Department History sheet
Overview
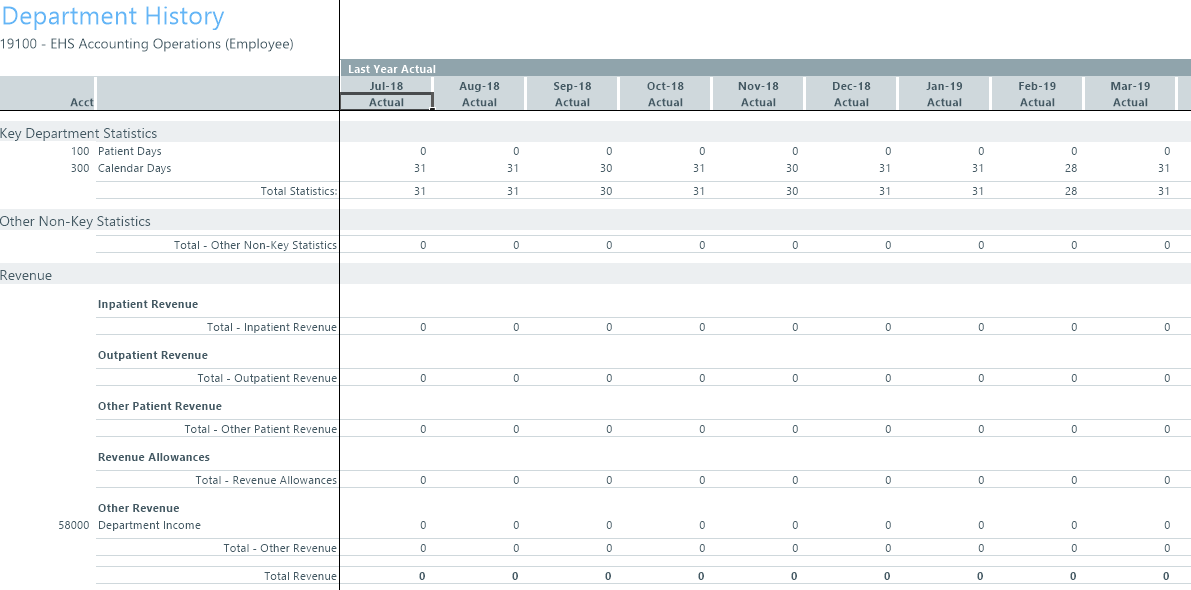
This sheet is a report that allows you to reference the historical spending trends for up to the last 18 months. This report is useful to keep open as you work on your budget. The reports is segmented into the following areas for statistics, revenue, expenses, and hours:
-
Last Year Actual - Includes values posted for over the last year.

Click image to view full size
-
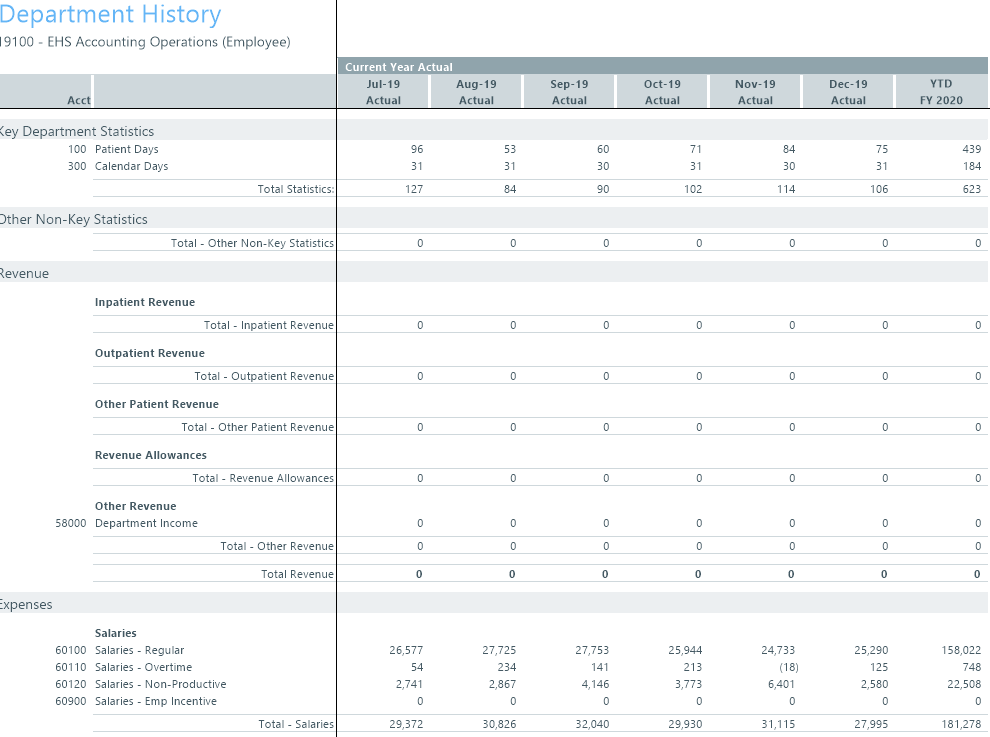
Current Year Actual - Includes values posted for YTD.

Click image to view full size
-
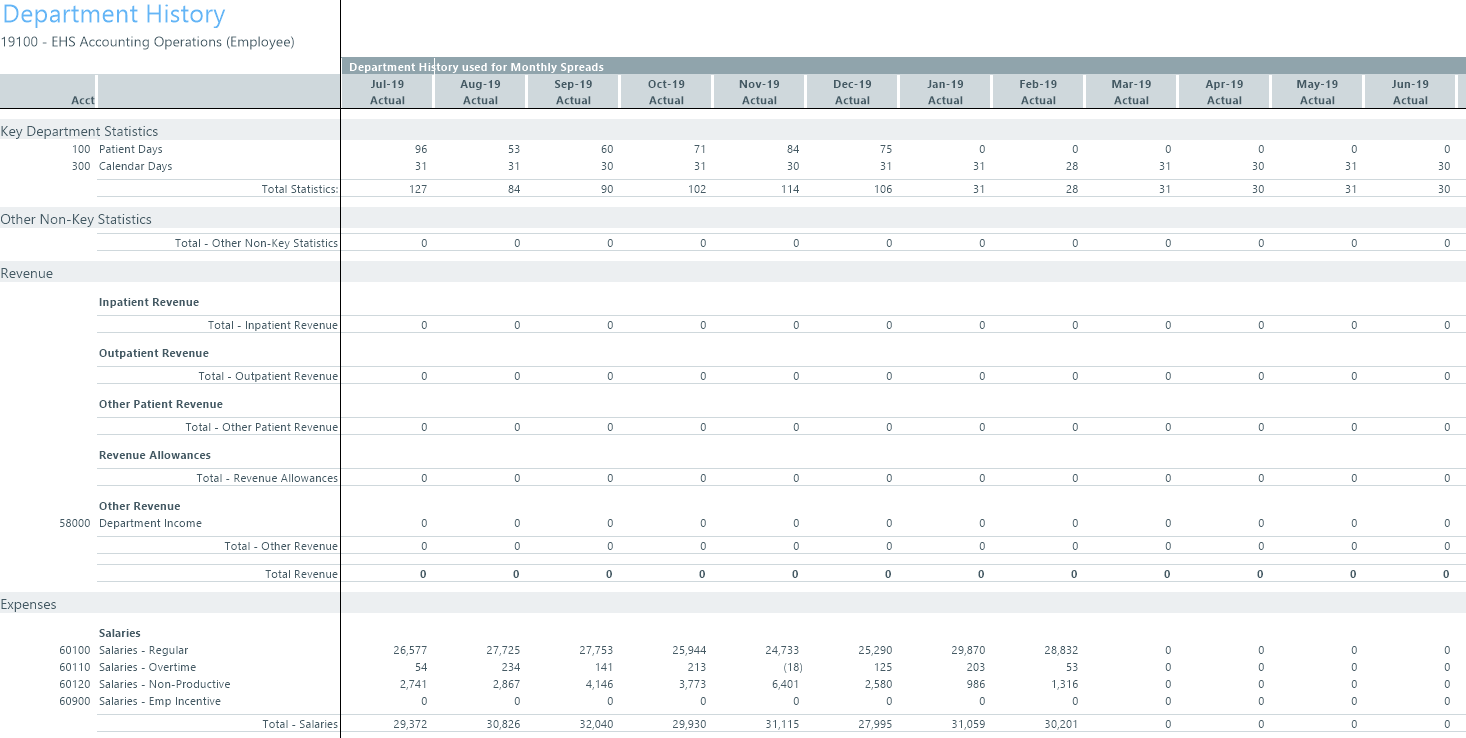
Department History used for Monthly Spreads - Includes a combination of YTD values plus the actuals from the previous year to form a full 12 months of data. In the following example, the actuals are posted through February 2019. In the Monthly Spreads section, the actuals are copied from July through February. But, for the missing months that have no actuals yet, the system copies the data from Last Year Actual and enters them for the missing months. In this example, the March through June actuals are copied from the same months in the Last Year Actual section.
TIP: Before you begin entering budget values, look for anomalies or holes in the Last Year Actual and Current Year Actual values that do not make sense or cannot be explained - especially if you intend to use this section. Make sure to resolve any data issues before you start creating a new budget for the next budget year or select an alternate spread option.

Click image to view full size
The system uses this combination of actuals and historical values to determine how to spread budgeted expenses across an account. So, if a department spends more money at the beginning of a fiscal year and adds a $10,000 expense to the budget, the system will automatically apply more of that expense to the beginning of the year than at the end.
TIP: The same historical information is also available in the Expense sheet at the expense line level. For more information, see Viewing historical values for expenses.